May 2026
The Case-Shiller Index provides a great historical view of home values in the San Francisco Bay Area. This index covers five counties, however does not include Santa Clara County (Silicon Valley).
Interesting to note that homes have appreciated by 6% on a compound annual basis (CAGR) since 1987, including a Great Recession. You can see the significant advantage of owning a home in the Bay Area compared to the national average. Clearly a benefit of our robust and growing economy.
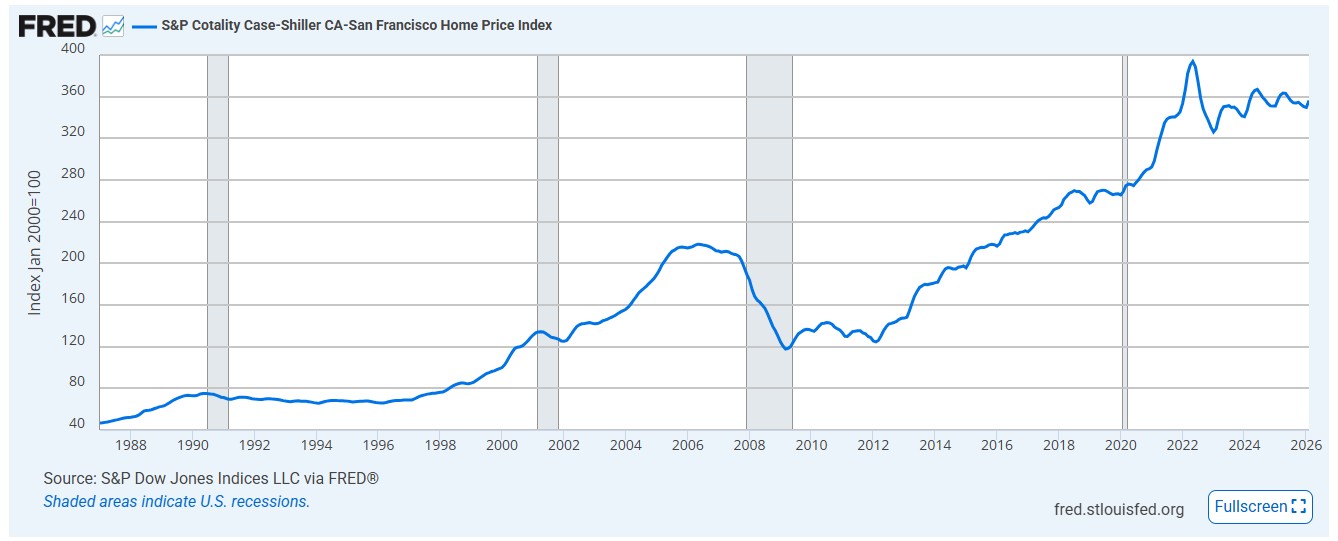
I find the Case-Shiller Index to be the best source for understanding long-term historical home pricing trends. My website at www.siliconvalleymls.com provides more specific pricing trends going back to 1998 for 12 cities in Silicon Valley, from Menlo Park to Los Gatos.